
How to Completely Evaluate the Sales Rank, Velocity, Price History, Competition, ROI, and Profit Potential of an Online Arbitrage Lead (to Sell on Amazon)
In our last post, we covered a few simple methods for sourcing online arbitrage leads for resale on Amazon. This post is a complete expert guide for analyzing an online arbitrage lead for resale potential on Amazon. We have included a table of contents below to help you navigate the tutorial.
In a way, reselling on Amazon is similar to studying a juvenile stock market. If you learn how to understand the history of a product, you are likely to be able to predict the future of it.
Even if you aren’t planning on running an online arbitrage or retail arbitrage business model, the information in this post will help make you an expert in analyzing product sales history and velocity on the Amazon marketplace. Consequently, you will understand any ecommerce business better, setting you up for more success in the future.
When you break down the decision of making a purchase for resale, there are several different components that have an effect on whether or not the product is a good lead.
In this MASSIVE article, we cover all of these components, what tools we use to analyze them, and how we make purchasing decisions based on the product information that the metrics reveal. We will show you the exact information that we use to train our sourcing team and buyers to make smart decisions on leads within our own online arbitrage business.
Once you understand the concepts of this article, you can teach them to your assistants and automate your sourcing and buying as well. It’s the toughest part of the business to automate, but if you put the time and effort in, it pays off big time. You can have pizza parties and celebrate all day.
Remember, online arbitrage is the method of finding products in one marketplace online and reselling them for profit on another marketplace online. In this case, there are thousands of online retailers offering discounted products, product sales, brand sales, and coupons which allow a margin to open up for resale.
If you know how to source leads, evaluate them, and buy them for the lowest possible unit cost, then you are in a position to build an incredible business on top of the principles.
Are you ready? Let’s dive in.
Table of Contents for This Post
To assist navigating this article, here is a table of contents for your convenience:
- Identifying the Product ASIN (Amazon Standard Identification Number)
- The Importance of ROI and Velocity in Online Arbitrage and E-commerce
- Installing Plugins and Tools to Evaluate Online Arbitrage Leads
- Metrics to Consider when Analyzing an Online Arbitrage Lead for Resale Potential
- Is the Product or Brand Restricted or Hazmat?
- Sales Velocity: What is the estimated number of sales for a product in a given period of time (day/month)?
- How to Win the Amazon Buy-Box
- Predicting Sales Velocity by Analyzing Sales Rank and Price Rank History Using Keepa Chart Trends
- How to Check Competitor Stock Levels
- How Ratings and Reviews Affect Product Sales
- How to Analyze Variations to See Which Sizes and Colors are Most Popular
- Estimating ROI and Profit Potential for any Lead
- Asking the Final Questions when Evaluating an Online Arbitrage Lead
Identifying the Product ASIN (Amazon Standard Identification Number)
There are several ways to identify a product ASIN, such as checking the product detail section of the Amazon listing or looking in the browser bar. If it’s an item with multiple variations (such as different colors, sizes, etc) then each listing will have a Parent ASIN, and each variation on the listing will have a Child ASIN.
What you need to know is that each product has a unique ASIN, and that ASIN is the universal reference identifier between sellers and Amazon.
The Importance of ROI and Velocity in Online Arbitrage and Ecommerce
Obviously, the main goal of buying a product is to resell it for a profit. But, because Amazon is a free market with direct competition between sellers and constant supply and demand changes, the profit that is often estimated can change rapidly between the time you purchase leads and the time they actually arrive on Amazon for resale.
This can be okay if the price stays stable or even increases a little, but often the price drops due to competition which decreases the margin. Because it’s a free market with rapid changes, it’s not only important to focus on profit and return-on-investment (ROI) potential, but also the velocity at which an item is selling.
Profit will always fall in line if the ROI converts, and sales will always take place if velocity is high and you are competitive with the other sellers in the marketplace.

FREE 19-PAGE GUIDE!
Buy Like a Pro! A Cheat Sheet for Estimating Buys in Every Online Arbitrage Rank and Category
Fortunately, there are some remarkable tools available to help out when evaluating products. Below is a list of the tools our team uses to analyze every online arbitrage lead, followed by a breakdown of the different types of metrics we track. If you have already implemented sourcing methods to find a few potential leads to analyze, this article will help you analyze those leads for resale potential.
Installing Online Arbitrage Plugins and Tools to Evaluate Leads
In the following sections, we will be diving into certain tools, extensions, and plugins for identifying metrics. It may help to go ahead and install some of these yourself so you can play around with them. Luckily, KEEPA and REVSELLER have gotten so advanced that we don’t have to install too many different plugins that only have one feature. Some of the plugins to install are:
KEEPA Extension – (Chrome, Firefox, Safari) Free and paid versions.
RevSeller – Product Rank, Competition, Price, and Variation Analyzer Regularly $99/yr but you can get a Free 30 day trial with 0 credit card needed! (Use code REVFBA20 to get $20.00 off your first year)
Context Menu Search (If you haven’t already installed it from the sourcing article, learn how here) – Free
JungleScout Extension – Lite Version – $97 – There is a little link under the PRO option that says “looking for lite version, click here.” Of course, the pro extension and the web app are also great for more extensive product research if you can swing a little extra loot.
CamelCamelCamel – Alternate to KEEPA (free and paid versions)
At the very minimum, install KEEPA so you can get a good feel for all the metrics we discuss below when evaluating an online arbitrage lead.
Metrics to Consider when Analyzing an Online Arbitrage Lead for Resale Potential
Once an online arbitrage product is identified to have resale potential, these questions need to be answered:
- Is the product restricted?
- Is the brand restricted?
- Is the product considered hazmat?
- What is the estimated velocity of sales for this item each month?
- What is the product category?
- What is the current sales rank?
- What is the average sales rank?
- What do the charts reflect for sales rank?
- How many other competitors are there?
- Is Amazon a competitor?
- How are the reviews and ratings performing?
- Is the price history stable?
- Have there been any price tanks or spikes in the past?
- If a product has variations, which are performing the best?
- What is the estimated ROI? (Return on investment)
- What is the estimated Profit?
- What % of the profit is absorbed by prep and shipping fees?
- Is the item optimal size and weight for FBA shipping?
- The smaller, lighter, and less fragile, the better.
- How much of each item should I buy?
Before you can hire and train product sourcers or buyers to analyze and purchase your products for you to help scale your business, it helps to be an expert at analyzing leads yourself. We recommend spending at least three months in this portion of the business to track leads that you purchase all the way through the sale. This will allow you to understand the flow of the leads.
There are so many possible outcomes to a lead’s life that this information and experience is vital for your business to succeed. Best-case scenario is the lead gets to Amazon and sells quickly for a profit.
But, as with any business, the best-case scenario isn’t always what happens. We can’t stress the importance of learning these metrics to help minimize error and risk.
To start, pretend like you have found a lead that looks like it has potential. Or better yet, do some sourcing and find a lead that you think has potential. The above questions outline the order of operations that you will need to analyze your lead with.
Below is a breakdown of each metric and how to measure it:
Is the Product or Brand You Are Evaluating Restricted or Hazmat?
Product and brand restrictions are one of the biggest headaches for Amazon resellers, as they create giant gates which block many sellers from being able to sell certain products based on categories, product safety classifications, and brands.
There are solutions for pre-determining if you can sell a product or not, which you absolutely want to check before you buy any item. Don’t get caught with your pants down.
Here are a few tips for checking if a certain product is restricted for your seller account or not:
Checking Restrictions on the Seller Central Web Platform – Free
You can usually check to see if a product is restricted or not by logging into your Amazon seller central account and entering the product ASIN. On the seller central website, navigate to Inventory > Manage Inventory > Add a Product and then type or paste the ASIN. You will see a blue link that says “Listing Limitations May Apply” if there are possible restrictions. If you can sell the product, it will show you which conditions you can sell it in (new, used, refurbished, etc) and there will be a big yellow button that says “Sell Yours.”

Amazon is constantly updating their system to be as accurate as possible, but it can still be tough to figure out if a product or brand is restricted or not. Sometimes it shows HAZMAT safety restrictions, and sometimes it doesn’t, so always have your team check restrictions with multiple methods if possible.
Checking Restrictions on the Amazon Seller Central App – Free
The Amazon Seller Central App is extremely accurate for checking brand restrictions. But, it can be kind of a pain because you have to type in the 10 digit ASIN into your phone every time you want to check something. We do it because it’s accurate, but it’s definitely not the best option for systems flow and time management purposes.
If you open your seller central app and click “add a product” you can type your ASIN in there. It will then bring up the product information screen, and about halfway down the page is a “Seller Eligibility” section. It will show a green checkmark if you can sell the product, and a big red caution triangle if you can’t.
Also, if you notice a red circle with a slash in the upper right corner of the listing, it indicates that the product is under safety review for hazmat, and it cannot be sold through FBA.

Get Your Quick Biweekly Update on News and Resources for Amazon Sellers!
Delivered to your inbox every other week.
Need-to-know seller content only. No spam. Unsubscribe at any time.
Checking Restrictions with AZInsight and RevSeller Tools
If you are the owner of some of the fancy multi-purpose tools, such as AZInsight and RevSeller, these tools also check restrictions and hazmat status in a much faster way.

The top plugin is RevSeller, showing the following:

The bottom is AZInsight, which also checks hazmat status on top of restrictions:

Although the methods above work about 99.9% of the time, there are situations where the information presented to us isn’t accurate. In an extreme case in 2017, we ended up with thousands of dollars in restricted items that we purchased and couldn’t sell.
Sometimes brands become restricted randomly, and other times the information that Amazon reflects on their site isn’t accurate. Either way, it’s not fun to get stuck in that trap, so be extremely careful when analyzing products for restrictions. Intellectual property rights are incredibly important and it’s your job as a seller to make sure you are legally following all Amazon policies and selling products you are authorized to sell.
Sales Velocity: What is the Estimated Number of Sales for a Product in a Specific Period of Time (day/month)?
Once a lead has passed the restriction verification test, the next step is to start analyzing the sales potential for the item. Obviously, you don’t want to buy products that aren’t going to sell. That defeats the purpose of online arbitrage in the first place. Any products that you buy for resale on Amazon should be selling relatively well, otherwise, you will be stuck with inventory sitting on a shelf.
The faster you can move product, the better. If you have massive amounts of items just sitting on Amazon shelves for months, Amazon will start charging you long term storage fees. In this business, cash-flow is your best friend. The faster the products move, the faster cash is transferred to your bank account.
This is why sales velocity is so important. You can’t make money with a product that isn’t selling. And, since Amazon is a free market and supply and demand change constantly, it’s smart to use all the tools available to make the best educated decision on how many units of each lead to buy.
If you analyze the trend of sales in the past up until the current date, you can make a fairly reasonable guess on how this product will sell in the near future. It’s much harder to predict the extended future. As listed at the beginning of this section, there are a few different components that play into estimating sales velocity, including:
- What is the product category?
- What is the current rank?
- What is the average rank?
- What do the charts reflect for sales rank?
- What is the sales rank for a certain variation?
Here is the exact process that our teams use to analyze sales velocity potential based off of past and current metrics for our online arbitrage leads:
What is the Amazon Product Category for an Online Arbitrage Lead?
Amazon classifies every product under a specific category. This category is broken down into a main category (parent) and sometimes several subcategories (child). These categories are used to make it easy for buyers to navigate to particular types of products they are looking for. These categories are also used to rank specific products among all products in the same category based on popularity and sales velocity.
Essentially, each product gets a “category” and a “rank.” Because Amazon is a marketplace that is constantly improving, they sometimes restructure and retitle categories on their site. Here is a list of the current Amazon main categories that a product can be classified under. The parent categories that our teams sell under when doing online arbitrage at the time of this writing are:
- Baby Products
- Beauty
- Clothing and Accessories
- Grocery and Gourmet Food
- Health and Personal Care
- Home and Garden
- Industrial and Scientific
- Jewelry
- Luggage and Travel Accessories
- Office Products
- Outdoors
- Shoes, Handbag, and Sunglasses
- Sports
- Tools and Home Improvement
- Toys and Games
- Watches
- Automotive
- Other various categories
The categories highlighted in bold are the categories in which the bulk of our products are classified. This is generally due to the availability of these types of products from sources that we are buying from. Nonetheless, there is an opportunity in ALL Amazon categories. The more access you can get to categories, the wider variety of products you can sell and the less competition to sell against.
How to Find the Amazon Product Category:
There are many tools that you can use to identify a product category, but you can also find it directly in the Amazon details section of the listing. Scroll down on any Amazon listing page to find the product details section, then identify the parent category on the lead.

Again, to estimate sales velocity, which we will discuss below, you must identify the PARENT category. In this example, the parent category is Grocery & Gourmet Food. The subcategories are more specific. A good way to imagine it is that the parent category is California, and the subcategories are Los Angeles, San Francisco, etc. The pool gets smaller. All you need to remember is that you need the parent category to estimate sales velocity and not the subcategories.
Very rarely you may come across a listing that only has subcategories and no parent category. This is usually a glitch in the system, and the best option is to stay clear of reselling any listing that only has a subcategory. The issue can be fixed by editing the listing, but generally, it’s easier to avoid the situation in whole.
Below, we will get into using other tools to identify product sales potential, and many of those tools also display the rank and category of a product. Some of these tools are google chrome extensions that embed directly into your browser, displaying the information on every listing that you open. Here are some examples of RevSeller and Scanalyze embedments:

On AZInsight, it’s in the top left corner:

When using KEEPA, you can view the information by clicking the ‘data’ tab:

For the purpose of this section, familiarize yourself with all of the categories available and how to find a product’s category. Each category has a different number of products that fall under its umbrella. Because this section is about metrics, we are going to use the product category as a reference to understand the potential velocity of sales for a product. To do this, we have to identify the product “rank” for a particular category.
Product Sales Rank: What is the Product Sales Rank of an Amazon Lead?
There are multiple ways to approach online arbitrage leads. Some people find products that aren’t yet selling on Amazon, and they create listings for those products and then try to drive traffic to them. This method can cost time and money to get traffic flowing to a particular product, to build reviews, and to gain rank.
Our approach is to identify listings on Amazon that are already selling really well and then source the product elsewhere for a cheaper price. So, for the purpose of this article, we will be explaining how to analyze a listing that is already live and selling on Amazon.
The sales rank of a product is controlled by Amazon’s algorithms. Therefore, to make a good estimate of a sales rank and what it means, you have to rely upon the metrics and tools you have, and then make an educated interpretation and estimate on your own. A product’s sales rank is often considered the most important metric as a whole when analyzing the sales velocity and potential of a product, but it’s also an area that is widely misunderstood.
To create a successful team you can trust to make correct sourcing and purchasing decisions in your online arbitrage business, you have to make sure they understand the power of correctly analyzing sales ranks. Tools like Keepa and CamelCamelCamel allow you to view not only the current sales rank of a product but also the history of sales rank from the beginning of time.
While these two nuggets of info can help you draw a fairly accurate conclusion on how well a product has sold and is still selling, it is very important to take into consideration the array of other metrics that we are discussing in this section as well, such as current and historical ratings & reviews, competition, price history, and more. You can’t rely on current sales rank alone to identify how well a product is selling, and this is often a huge mistake for new or uninformed sellers.
To interpret and predict sales potential accurately, you must answer these questions:
- What is the category? (As from the section above)
- What is the CURRENT sales rank in the category?
- What is the AVERAGE sales rank history for the product?
- What is the sales rank trend for the product? (Is it selling the most in particular times of the year, or is it fairly steady all year round?)
- How do the Keepa or CamelCamelCamel charts look?
Current Sales Rank vs. Average Recent Sales Rank
Current sales rank is a measure of how long it has been since an item last sold. When an item sells on Amazon, it’s not unlikely that the sales rank will drop dramatically to a lower number (closer to 1). Then, as time starts to pass where it isn’t selling, the rank slowly starts to slide back up.
The lower the sales rank number, the faster the item is selling. A sales rank of 1 is the fastest velocity of sales possible, while a sales rank in the millions is often a very slow selling product. However, remember that the current sales rank really doesn’t mean much in relation to the average sales rank (usually over the past 30 days).
If the current sales rank is close to the range of the average sales rank over the past 30 days (ex: Current: 24,000, and Average: 40,000), it’s a pretty safe bet that the current sales rank is a good indicator of average sales. However, if the average sales rank is around 100,000 and the current sales rank is 30,000, it’s possible that the current sales rank is misinforming or temporary.
The trend might indicate that the sales rank for the product will most likely slide back to around 100,000 to satisfy the average. Alternatively, the product could just be becoming more popular and thus moving toward a better long term sales rank. Use the average sales rank as your anchor and factor in the current sales rank by identifying recent trends of the rank. Then, use a combination of the two to make an educated guess on the best rank to use for estimating sales potential. A few key notes to keep in mind:
- Current sales rank is dependent on the amount of time since an item last sold.
- Don’t count out items with poor current sales ranks if the average is better.
- If an item isn’t selling much at all, it may not even carry a sales rank.
Identifying Current and Average Sales Rank Using the Detailed Amazon Listing:
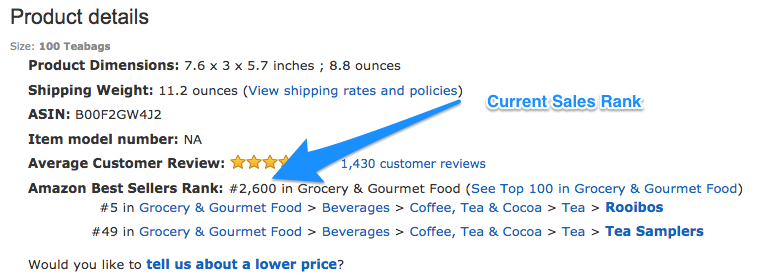
Scroll down to the product details section that you looked at to check the category. The current rank displays in front of the parent category. This product is currently ranked #2600 in Grocery & Gourmet Food. The product details page doesn’t display the average sales rank.
Identifying Current and Average Sales Rank Using KEEPA
There are a few different ways to analyze current and average rank with KEEPA. The most direct way is to click the “data” tab and view the information under current and averages:

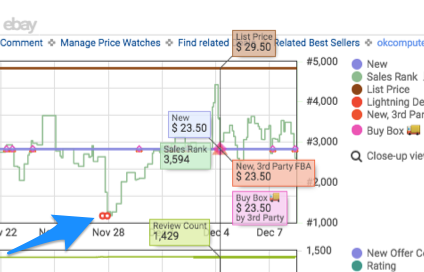
You can also make an educated guess by viewing the ranking graph trends. You’ll notice below that the GREEN graph is the Sales Rank (as the arrow points to). If you draw a line across the green graph trend, you can get a good estimate of the average. The blue line I’ve drawn below shows an average around 2600-3200, which correlates with the numbers from the data tab above.

You may notice all the other information on this graph. We will get the importance of the other information in the following sections. You can toggle the information on and off by clicking the colored dots to the right of the graph. If you want to only view sales rank, you can.

Identifying Current and Average Sales Rank Using RevSeller
RevSeller identifies the current rank in bold and the 90-day average rank underneath.

Identifying Current and Average Sales Rank Using JungleScout Extension
If you decide to use JungleScout, you can click the extension button on any listing and it will spit out all the information necessary to estimate sales and velocity. We will revisit this extension to discuss sales velocity later in this article.

Estimating Sales Velocity (The average # of sales per month)
Once you have identified the sales ranks and the category, you can then use the information to estimate the average # of sales a product makes per month. If you can identify products that are selling a high average number per month, then chances are you will be able to sell them quickly once they arrive at Amazon so long as your pricing is competitive.
Free Tools to Estimate Average Sales Velocity for Amazon Products:
FbaToolkit.com – FbaToolkit is an older website that allows you to plug in a sales rank for a particular category and it will estimate the number of sales per day and month. You may notice that this tool often predicts a lower amount of sales than other paid tools. It only offers some categories and looks to be fairly outdated, but still works. For a rank of 26,000 in Grocery and Gourmet Food, it is predicting about 3-5 sales per day. Again, it’s super old and we aren’t sure it’s even updated metrically, but if you are rolling the dice for free it may help.

Unicorn Smasher – Unicorn Smasher is a free alternative to JungleScout. We don’t currently have it installed, so we cannot show you the sales estimate based on the example we’ve been looking at, but here is a screenshot of an estimate for a toy:

FREE 19-PAGE GUIDE!
Buy Like a Pro! A Cheat Sheet for Estimating Buys in Every Online Arbitrage Rank and Category
Premium Tools for Estimating Sales Velocity for Amazon Products:
JungleScout – Our teams use Jungle Scout because it’s proven to be reliable, but many other sellers use Unicorn Smasher with great results. Sometimes the # of sales it predicts are a bit exaggerated, but between Keepa and Jungle Scout you should have a pretty clear idea of how many units are selling. As you may have seen from the screenshot we shared above for viewing the average product ranks, it also displays an estimated # of sales based on the rank.

The estimated average monthly sales on this product is 527 units, selling around $18.23 each. If you multiple 527 x 18.23, you get an estimated sales revenue of $9,607.21. If you want to analyze the product based on the current rank, JungleScout breaks that detail down also:

If the product stays at the current price and rank, it would sell 947 units per month at $23.50, which adds up to $22,255 in revenue per month! We always stick to analysis based on averages because it’s more accurate, but it’s good to see how the smallest change in rank affects the velocity of sales. To take it further, you can look at the history of sales velocity by hovering your mouse over any of the column boxes. When hovering over the Sales box, you should see this:

If you click the “view product monthly sales history” it will open up a graph of the sales history and you can view the trends of the product sales over the lifetime of the product:

If you understand how much an item is selling per month on average, you can then feel much safer when purchasing a given quantity. When a product has an average monthly sales estimate of 500, then buying 50-100 of an item to resell shouldn’t be a problem given there isn’t mass competition.
The item should sell quickly. If an item is only estimated to sell 20-30 per month, then buying 10-20 of the item to resell probably makes more sense. Using this Jungle Scout tool is awesome, and it makes it much easier to estimate sales velocity. However, you can predict sales based on the free KEEPA charts as well, which we will dive into in a moment. First, let’s look into the importance of winning the buy-box on a listing.
Winning the Amazon Buy-Box in Your Online Arbitrage Business
The buy-box is the main area on an Amazon listing that includes the button “Add to Cart” for a consumer. Only one seller can own the buy-box on a listing, although the buy-box winner often rotates between sellers with the lowest offers. Around 90% of sales on Amazon are converted through the buy-box.
In the center of the listing, usually under the price and shipping details, there is an area that identifies which seller currently holds the buy-box. Basically, if you add the item to your cart, the seller in the buy-box is the seller that will actually get the sale. In the example below, you can see this item is being sold by OPOLAR and fulfilled by Amazon. OPOLAR is using Amazon to store their inventory and fulfill their orders through Amazon FBA, the same system we use. However, OPOLAR is actually the owner of this product brand too. (good for them, this product is crushing)

Again, Amazon allows multiple sellers on each listing, as long as the sellers have permission to sell the product on the listing. Sometimes a brand is owned by one seller, and therefore there will only be one seller on the listing. This can be obtained through brand registry or possibly striking an exclusivity contract with the brand owner.
Multiple sellers on the same listing is one of the main differences between eBay and Amazon. At any time, you can view all of the sellers on a listing by clicking the “Other Sellers on Amazon” link underneath the Add to Cart button on the right.

Once you click the link, it will display the other sellers in a list:

You can see that OPOLAR is winning the buy-box because the condition of the product being offered is “new” as opposed to “used-like new” like the Amazon WarehouseDeals seller. They are also the brand owner, so no other FBA sellers are competing on the listing.
So, if you have an online arbitrage business and are selling a product on a listing, chances are you are competing with multiple other sellers who are also trying to sell the same product, perhaps also doing online arbitrage or retail arbitrage.
This causes a few problems:
- Only one seller can be in the buy-box at a time. Amazon’s algorithms constantly rotate the buy-boxes between eligible sellers, but if you aren’t in the buy-box, you probably won’t make the sale.
- Competition, therefore, competes for the buy-box, and often this involves competitors dropping their prices to win the buy box. This can rapidly tank the selling prices on listings, causing the ROI and profit predictions you make when sourcing to lose their margins.
In summary, make sure you and your buyers are aware of who the other sellers are on the listing you are analyzing. If you can’t win the buy box, you can’t make a sale. If your account is in good standing and your seller feedback is high, you shouldn’t have any issues rotating into the buy box if you pay attention to the following tips:
Main Factors that Influence Buy-Box Ownership on Amazon
- Amazon favors sellers who use Amazon FBA fulfillment services or offer Prime speed merchant shipping services.
- Offer Price – the most competitive Amazon FBA prices usually win the buy box.
- Seller Metrics and Feedback Rating – Sellers with a long, stable history of good performance and positive feedback are likely to win the buy box over sellers who have performance issues or negative feedback.
4 Quick Tips for Owning the Buy-Box on Amazon
- If Amazon is a seller on a listing, they will almost always be in the buy-box. Steer clear of trying to resell on listings where Amazon is a seller.
- If there is a massive amount of sellers on a listing all competing for a buy-box, it’s generally safer to not join the listing unless the margin is large. It will be much harder to win the buy box if it’s rotating between 10+ sellers, and the sale price will probably tank by the time your products arrive. If the margin is big, there may still be profit and ROI available after the price tanks, but products with a lower number of sellers are definitely more favorable.
- Always offer the most competitive price relative to your competition. If you are selling via Amazon FBA, then you should be matching or beating the lowest Amazon FBA price on the listing. You can still win the buy-box if your price is 3-5% higher than the lowest competition Amazon FBA seller, but chances are the lowest price will be in the buy-box. Remember, high-performance ratings and positive feedback heavily influence buy-box eligibility.
- Use a repricer like Informed.co to automatically stay competitive with prices and win the buy-box.
How to Use Keepa: Predicting Sales Velocity by Analyzing Sales Rank and Price Rank History Using Keepa Chart Trends
First, let’s break down a full Keepa chart and explain the different areas. If you have Keepa installed as an extension on your browser, a chart similar to the following will show up when you load an Amazon listing:

There is a lot going on in the chart above, and it’s all valuable information that helps us make buying decisions.
Top KEEPA Chart – Pricing, Rank, and Buy-Box History
- The vertical axis on the left represents the product price.
- The horizontal axis on the bottom represents the date range that the product has been live on Amazon.
- The vertical axis on the right represents the product rank.
Bottom KEEPA Chart – Offer, Competition, and Review Counts
If you have just installed Keepa, click the “More Historical Data” link in the bottom right corner to open up a second chart that displays offer, competition, and review counts. The right vertical axis represents the count. The offer, competition, and review counts are displayed on the graph via different colored lines.
Keepa Chart Aspects
Notice the navigation column on the far right of both charts. Each colored dot represents a different aspect of this chart, and each aspect is represented on the chart by that same color. You can turn color on and off if you want to view solo aspects. You can also view by time frame from the day or through the entire history of the product. In the example shared above, we are looking at the history of a month. Chart Aspects include:
- New Price
- Sales Rank
- List Price
- Lightning Deals
- New, 3rd Party FBA Prices
- New, 3rd Party FBM Prices
- Buy Box Price
- New Offer Count
- Rating
- Review Count
Keepa: New Price History – Blue Line
The New Price is represented by the blue line on the top graph. This line displays the marketplace (Third Party Seller) current low offer price for a product in NEW condition. It’s important to remember that the Price History line is based on ALL SELLERS, not just FBA, so it may show the price being way lower than what the FBA and buy box price actually is.
If there is a third party non-FBA merchant seller with a price of $9.00 + $11.00 shipping, the blue line will drop all the way down to $9.00 even though the current buy-box price is actually $23.50 (because Amazon doesn’t usually give the buy-box to merchant sellers w/out free shipping). Example analysis: It looks like the lowest NEW price for the last month has stayed at $23.50, which is extremely stable. In future examples, you’ll notice that that sort of stability isn’t always the case.
Keepa: Sales Rank History – Green Line
In the Current vs. Average Sales Rank section earlier in the guide, we identified how to estimate the velocity of sales based off the sales rank. On the Keepa chart, you can view similar information by analyzing the green line. The lower the green line, the higher velocity of sales. Generally, each time the green line spikes down to a lower rank, it is indicative of at-least one sale. If multiple sales are occurring, the line will stay down low. If it starts to fade up towards a higher rank, it means the product hasn’t sold in a while.
Keepa: List Price – Brown Line
The list price is usually the suggested retail price of a product by the manufacturer or MSRP. This line is usually consistent but sometimes changes if a product has a newer version that is on the market.
Keepa: Lightning Deals – Red Infinity Symbol
Sometimes a red symbol that sorta looks like the infinity symbol will show up on the graph. This represents a Lightning deal, which is a special sale that an Amazon seller hosts for a limited amount of time. Unless you see a bunch of these, this is generally something you can ignore. In this example, someone created a lighting deal around $19.00 in price, and the sales rank graph spiked to an all-time low near 1,000 in rank because of the velocity of sales from the lightning deal.
Keepa: Amazon.com Prices – Orange Shading
Amazon also sells its own products on certain listings. If Amazon is offering a product on a listing, the entire graph will have a shade of orange up to its offer price. The graph above does not have Amazon as a Seller. If Amazon is selling on a listing, it’s tough to resell on the same listing. Amazon almost always wins the buy-boxes.
Keepa: New 3rd Party FBA Prices – Red Triangles
When looking at the graph, the little red triangles represent 3rd Party FBA seller prices. These are sellers using the fulfillment by Amazon service. As an FBA seller, you should mainly only concern yourself with the price of other FBA sellers. The red triangles are the most important price points that you must analyze because it’s the price point that you will be competing with as an FBA seller.
Keepa: New 3rd Party FBM Prices – Blue Triangle
If you see a blue triangle, it represents the 3rd Party fulfilled by Merchant sellers who guarantee 2-day fulfillment, just as Amazon FBA does. These sellers are also your competition, but they are fulfilling directly from their homes or businesses, as opposed to using Amazon FBA warehouses for fulfillment.
Keepa: Buy Box Prices- Pink Diamond
The pink diamonds represent the current price of the offer that owns the buy-box. Many times, the red triangles from the 3rd Party FBA Sellers will overlap the pink diamond for the current buy-box price. This is because the 3rd Party FBA Sellers generally own the buy-boxes because the Amazon algorithm favors them.
Keepa: New Offer Count – Blue Line
The new offer count is represented by a blue line on the bottom graph. This is the number of new offers, or sellers offering the new product, on the listing. In the example above, there is only 1 new offer. There has only been 1 offer for the past month, which means there is only 1 seller offering this new product. The higher number of offers, the higher the amount of competition for the buy-box.
Keepa: Rating – Turquoise Line
The rating line represents the average product rating history on a scale of 1-5. The higher the product rating, the more likely it is to sell.
Keepa: Review Count – Bright Green Line
The bright green line on the bottom chart represents the number of product reviews. The more a product sells, the more reviews it generally receives. If an item has a high number of reviews and a high rating, chances are it is selling really well. The higher the number of recent reviews, the better.
Keepa: Analyzing Sales Rank & Price History Trends through Examples
Let’s take a look at some examples so we can identify how all the individual KEEPA metrics work together to help us analyze leads for the online arbitrage model. Remember, you can estimate sales velocity more accurately by using tools like JungleScout and Unicorn Smasher. The purpose of these examples is to diagnose rank and pricing history and trends so we can solidify good buying decisions and prevent mistakes.
When analyzing sales rank on charts, it’s important to remember that each product has a specific category and that a rank of 50k in one category does not equal the same sales velocity as a rank of 50k in another category. Some categories have a wider variety of high selling products, and therefore higher ranks sell better than other categories with a lower variety.
Keepa Example 1:
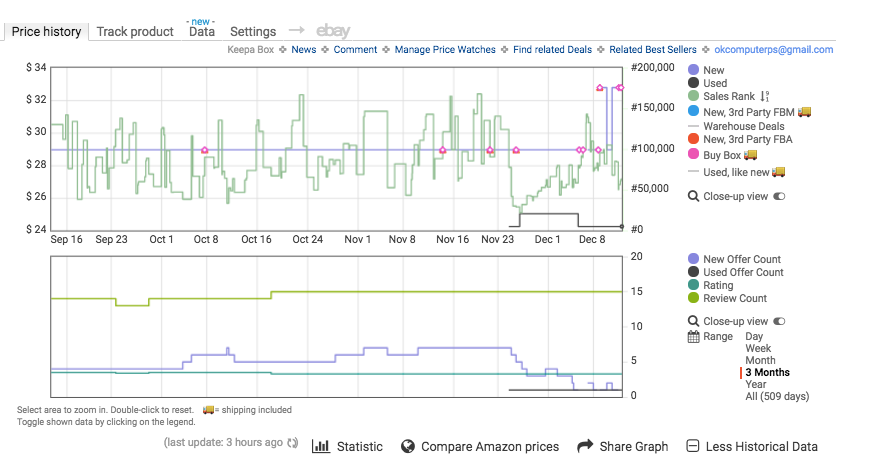
The new price, the 3rd Party FBA Price, and the buy box price were all traditionally around $29 until just a few days ago when all 3 spiked to around $32. If you look at the new offer count on the bottom, you can see that the number of sellers offering the product dropped, which indicates that the seller with the lower prices went out of stock, driving the price up to the current $32.
The review count hasn’t increased much over the past 3 months, and the sales rank has been steady around 75k. Most likely, the sellers that went out of stock will come back in stock, and the price will drop back down to the $29 range. If I were analyzing this lead, I would measure it based on a sales price of $29 and not the current $32 price. The amount of sales rank spikes indicates that this product is selling moderately, but certainly not insanely fast.
Keepa Example 2:
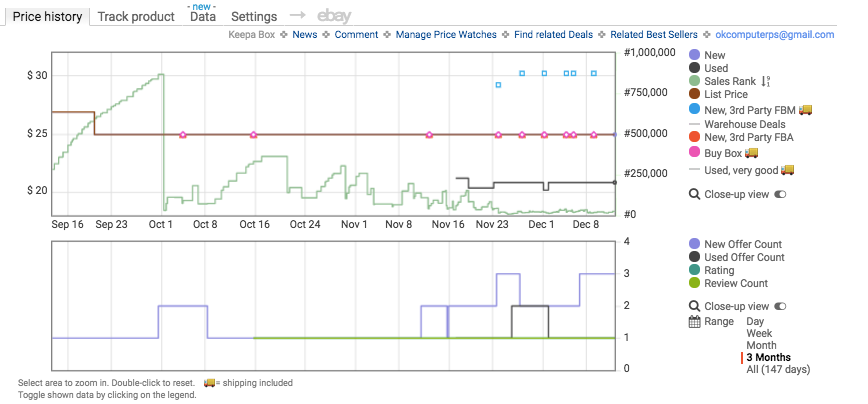
This example only shows between 1-3 offers available. The list price is around $25.00, which is exactly what the New 3rd Party FBA and buy-boxes are at also. This means the 3rd Party FBA Seller owns the buy box. The 3rd Party Merchant Sellers are offering a higher price around $30 and they do not own the buy box. The sales rank graph started out slow and has picked up velocity over the past 3 months.
In September it was barely selling at all, as the rank faded all the way up to nearly 850k on October 1st, and then it spiked down under 100k. You might notice that the new offer count also went from 1 to 2 on the same day, meaning a new seller added an offer to the listing. With this new seller’s offer, sales drastically picked up. Since the price was around $25 before and after the new seller came onto the listing, the only difference we can pinpoint is that the new seller was a 3rd Party FBA offer, and before it was not.
Once the product was offered through Amazon prime, the rank started to spike and the sales velocity started to increase. With how low this sales rank is stayed, nearly hugging the 0 line, we can tell this product is selling insanely well at a price around $25 from a 3rd Party FBA Seller.
Keepa Example 3:
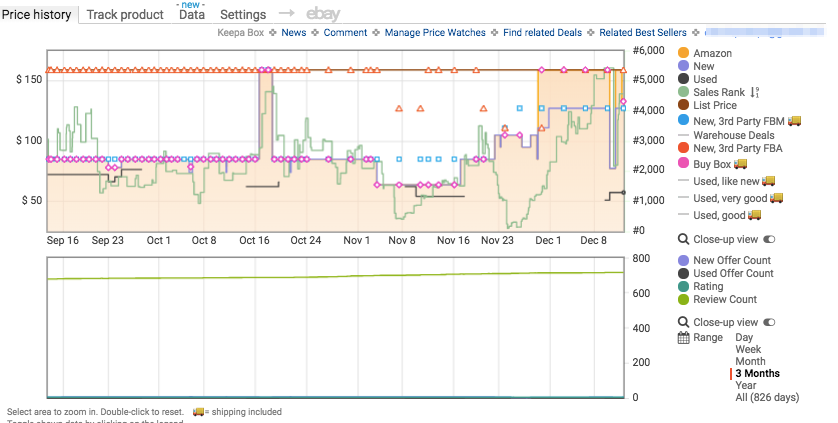
The new offer count isn’t appearing, which sometimes happens on these graphs, but we can see that there are multiple offers based on the amount of 3rd Party symbols available on the graph. Amazon is selling this item themselves, which is indicated by the orange shading. Again, if Amazon is selling this product, you want to stay away. They usually always win the buy boxes. You can see that Amazon’s price was around $90, dropped to around $75, then slowly went back up all the way $150!
The pink buy-box triangle followed it no matter where they set their price! You can also see that other 3rd party FBA Sellers have set their prices lower than Amazon’s after December 1st, but the buy-box has stayed with Amazon’s price of $150. Also, the velocity of sales peaked around November 23 (Black Friday time), then slowly faded as Amazon almost doubled their price. When prices are spiked, ranks usually slow down. If Amazon is on a listing, it may be best to stay away unless you are familiar with the process of selling against them.
Keepa Example 4:

In this example, the view is expanded to the “all-time” date range. This is a Christmas themed product, and it’s important to point out the trends in the chart. Last year, in November, the rank on this product spiked toward 0 because people were buying it as a decoration for the holidays. Then, after Christmas, the rank slowly started to fade up over 100k for the entire year until November rolled around again. Then, it shot back down toward 0, selling like crazy again before the Holiday season.
It’s also important to point out the giant spike in offers on the bottom chart. Notice that the offer count went from under 10 to over 75 sellers. Because of this, there were 75 sellers competing for 1 buy box, and the price war started. From the beginning of November to mid-December, the price has slowly tanked from around $50 to $25 because of the competitive repricing to try and win the buy-box.
You will see similar trends on long term graphs for seasonal items like sandals and bathing suits (summer items) or winter coats, as well as spikes in sales velocity for other holiday specific items during their particular time of year.
Keepa Example 5:

First, Amazon has been on this listing forever, up until about a week ago, which means it’s safer to stay away from it. However, there are a few notable metrics to point out a few things happening in this graph so you can understand the trend. Amazon has offered this item around $120 traditionally and they held the buy-box the whole time. The average sales rank was holding around 500-1000 which is INSANELY high velocity.
Around Dec 3rd, Amazon went out of stock, which is why the orange shading disappeared. Because of the high velocity of sales on the listing, other 3rd party offers also started selling out, driving the price up to higher offers around $200. The sales rank has faded to around 2500 at these higher offer prices, but it’s still an extremely high sales rank. Amazon will most likely be back in stock soon, but the sellers who won the buy boxes around $200 in Amazon’s absence probably made some pretty good money.
Keepa Example 6:

The massive amount of sales rank spikes means high velocity and action on sales. The list price is around $26, but the New Offer price has been in the range of $15-20. However, notice the buy-box is hugging the 3rd Party FBA offer price which has been fluctuating between $22 and $35. Despite there being lower New Offer prices from 3rd party non-FBA sellers, Amazon is giving the buy box to the sellers who are using their FBA services.
The average sales price for an Amazon FBA seller is around $24, so it’s best to estimate your ROI and profit off of that sales price, as opposed to the recent spikes around $30. The higher price may sustain, but the trend indicates that it will most likely drop back down to the average around $24. There is no orange on this listing, so Amazon is not a seller. Good news!
Get Your Quick Biweekly Update on News and Resources for Amazon Sellers!
Delivered to your inbox every other week.
Need-to-know seller content only. No spam. Unsubscribe at any time.
Here are a few more quick examples for analyzing the sales rank lines only:

Incredibly high velocity of sales and price history. The closer the green line hugs the rank of 0, the better.

Pretty good rank action (around 50k average). Up until June 16th, the pricing was pretty consistent, and then it tanked from about $36 to $30. Notice on this product that the price drop didn’t seem to accelerate the number of sales by much.

Pretty good rank, medium velocity of sales. The wider the sales rank spike ranges, the slower the sales.
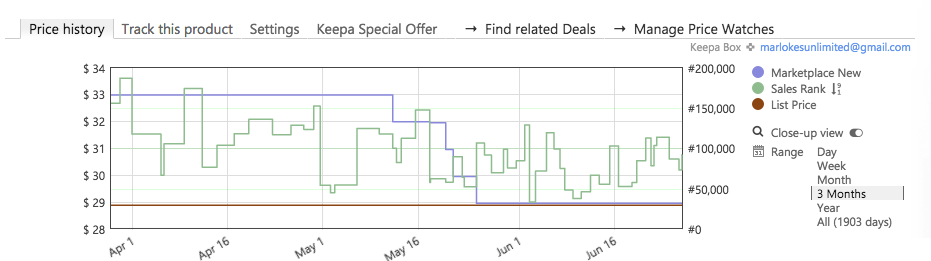
Mediocre sales velocity + a recent price tank from $33 to $29. Notice how the sales seem to have picked up slightly after the price dropped. This is a pretty common occurrence.

Terrible rank and velocity. There are only 2 spikes on this entire graph, indicating only a few sales over the life of the product. If you see a graph like this or a graph that doesn’t have a green line or rank at all, stay away.
How to Check Competitor Stock Levels for Amazon Products
When analyzing a product, especially an online arbitrage lead, we mentioned the importance of evaluating the number of sellers on the same listing. If a listing has multiple sellers all rotating in and out of the buy-box, then all these sellers have to share the total velocity of sales.
Sometimes when analyzing a lead, it helps to know how many units a seller has in stock. If there are 5 other sellers who all have a big stock count, it may be harder to get sales once your products arrive. However, if there are 5 sellers who are all only holding a few units each, then you could estimate that they will probably sell out before your units even arrive for sale, and then you would have a pretty good shot of winning the buy box.
There is an awesome tool called AMZScout Stock Stats that allows you to check the quantity of units for each particular seller on a listing with one click accurately. Keepa and AZInsight also have built-in stock checking tools.

You can install it as a google chrome extension here.
How Ratings and Reviews Affect Product Sales on Amazon
In the Keepa charts above, notice the history of ratings and reviews. This is pretty straight forward, but it’s worth mentioning because it can help make or break a purchasing decision. In general, the higher the rating and number of reviews on a listing, the better it is selling. Also, when someone leaves a rating or review, it potentially pushes the product up in Amazon’s rank charts, which in turn can result in more sales. Of course, sales are the most important part of an online arbitrage business, right?
When an item gets a new review, it gets a slight favor in Amazon’s algorithm. A higher favor by Amazon’s algorithm will put it in front of more people when they log onto the website to shop, resulting in a higher chance of sale, and more sales equals a better rank.
Sometimes an item may have a large number of ratings and reviews, but the rank and velocity may be really slow. This could be a product that was popular a few years ago but is no longer selling well. On the other hand, there could be products that have very little ratings and reviews, but the sales rank and velocity show that they are selling extremely well. This could be a new product on the market that people haven’t gotten around to review yet, or it could be a product style that many people buy but never review (think condoms, personal products, etc).
Although the tools above and the Keepa charts are the main reliable sources for predicting sales velocity, it’s also good to analyze the ratings and reviews for extra support.
Quick Online Arbitrage Tip: Look to see how many recent reviews there are. If there are recent reviews, the item is most likely selling. A very small % of people who purchase a product actually leave a review, so if you see a large number of reviews, the amount of purchasers is probably way higher! There are several ways to check ratings and reviews.
Viewing a Product’s Reviews Manually on Amazon
If you are on an Amazon product page, underneath the title there is usually a rating and review count:

If you click the blue link, it will open up a page where you can see all the ratings and reviews. By default, it will show you the most popular reviews, but you can also sort by the most recent reviews. Click “See all X customer reviews” and then sort by most recent.

Sort by “most recent”

If you see reviews that are current, then it’s a good sign that the product is selling. If the last review is from a year ago, then chances are the product is a slow velocity item.
How to Analyze Variations to See Which Sizes and Colors are Most Popular
Many of the products that online arbitrage teams sell are in the clothing and shoes categories. Unlike selling a specific item like a toy, many products come offered in various sizes and colors, also known as “variations” in Amazon terms. From a technical perspective, if there are variations of a product, that variation is a ‘child’ of the ‘parent’ product. Therefore, there is 1 parent ASIN, and multiple child ASIN’s underneath the parent ASIN.
When purchasing items with variations for resale, the goal is to purchase the variations that are popular so that we can actually resell them. In clothes, for example, neutral colors like black and grey sell way better than exotic colors like highlighter yellow or fuschia. Instead of buying all of the colors blindly and getting stuck with colors that won’t sell, you can analyze the reviews to see which variations are selling the best. The variations with the most reviews are usually the most popular.
How to Analyze Popular Product Variations Manually for Online Arbitrage
If you are viewing reviews manually, as discussed above, you can also see which “variations” were reviewed the most. Usually, if a certain variation is reviewed more than others, that’s a good sign that it’s more popular than the others. Underneath each review, on the 3rd line down, you can see which variation is being reviewed.

How to Analyze Popular Product Variations with RevSeller for Online Arbitrage
Perhaps the most powerful tool that RevSeller offers is its variation viewer. You can use this tool to quickly view the pricing and variation popularity of all variations in a single window. Before this tool was out, we spent hours selecting each size and color individually and waiting for the new information to load on the page.
It was really hard to tell what variations were popular, and it took forever to check the ROI and Profit potential of each individual variation. Thanks to RevSeller, that painful headache is long gone! If you are on a listing, click the ‘variation viewer’ button that appears if you have RevSeller installed.

In the middle, it shows you a list of all the reviews for each variation. It looks like all the volumes are fairly popular given the sales ranks, but Volume 4 has the most reviews. It’s safe to assume that volume 4 is selling just as well as the other volumes. Because Volume 1 has a much lower sales rank and a good amount of reviews, it is probably selling the best overall. On listings with clothing and shoes, the variations may show up as having the exact same sales rank. In those situations, considering the number of reviews for each variation helps tremendously.

In this example, all variations are sharing a combined rank of 19. The top half of the review list are the colors that are selling the best, all with 7+ reviews or more. In any case, at this rare rank, every color and size is likely selling crazy fast. At the bottom, it breaks down the ASIN, the number of reviews, rank, category, variation name, sale price, and amount of competitive offers for each variation!
This information is crucial, and this is why RevSeller is so valuable. There are listings that have hundreds of variations, and it easily compiles the information so we don’t have to spend time going through and analyzing each one. Make sure you pay close attention to which variations are the most popular, and which ones are selling at good margins.
You can even click on the variation row in RevSeller and it will open up the individual Keepa graph for that variation. Don’t ever assume that all of them are selling good and at high margins just because one color or size is. You’ll end up in the debt chambers.
A few quick tips for purchasing variations for online arbitrage are as follows:
- Always analyze the metrics of each individual variation
- Normal sizes sell better (medium and large sell better than small and xl in MOST cases)
- Neutral colors usually sell better (Blacks, Blues, Greys, Whites and not weird yellows/greens)
- The less amount of variations on a listing, the higher chance that all variations are selling well.
Analyzing Price History for Variations with Keepa
Up until recently, the Keepa sales rank graphs didn’t work for listings that offered multiple variations. Variations are different sizes, colors, or styles offered for a single product on a single listing page. Luckily, Keepa has now implemented individual data for variations as well. Select which variation you want to view, and you should be able to see a unique chart for each variation.
If you come across a variation that has a poor looking ranking chart, it probably means that size or color isn’t as popular as other sizes or colors. Unfortunately, not all listings have this feature and you will still come across listings where the child variations all carry the parents rank and chart.
If you notice that all the individual Keepa charts are exactly the same for each variation on a listing, you can try to double-check the individual items on CamelCamelCamel. If they still look the same, we’d suggest sticking with buying only the popular sizes and colors from the reviews or your own common sense.
Summary of Price and Rank History Analysis for Online Arbitrage
Now that you know the basics of checking sales velocity and analyzing price history, we are going to transition into estimating ROI and profit potential for your online arbitrage business. The graphs we just covered may feel overwhelming, but you will become an expert at analyzing them over time. The more you look at them, the more you’ll understand the ranking, price, and competition trends. All of the information is vital when analyzing a lead, so spend some time reading and interpreting the charts.
FREE 19-PAGE GUIDE!
Buy Like a Pro! A Cheat Sheet for Estimating Buys in Every Online Arbitrage Rank and Category
6 Quick Tips to Remember When Evaluating Listings for Sales Rank and Price History for your Online Arbitrage Business
- Avoid listings that have Amazon as a seller. They usually win the buy box.
- The lower the sales rank line to 0, the faster the item is selling. Close rapid spikes indicate a high velocity of sales, while really wide spread out spikes indicate slower sales. When the spike dips towards the 0, it means a sale has occurred.
- Avoid listings with a large number of sellers competing for 1 buy box. Chances are that the price will tank as buyers compete to win the box.
- Target listings with high product ratings and a high number of recent product reviews.
- Pay attention to recent price spikes or dips, and analyze the lead based on the averages and not the current outlying trend.
- Analyzing the 3-month period is helpful, but also remember to look at the price history, the history of buy-box pricing, sales rank history, and more! All of this information is vital in predicting the future trends of the product.
Estimating ROI and Profit Potential for an Online Arbitrage Lead
Up until this point, we’ve covered the following in this post:
- How to identify if a product has potential restrictions
- How to identify the category, sales rank, and velocity of sales per month using third-party tools
- How to analyze Keepa graphs to check the price, sales, competition, buy-box, and velocity trends
If a lead passes the parameters in all of the above sections, then the next logical step is to analyze actual profit and ROI potential. If there isn’t any return on investment or profit, then there isn’t any point in further analyzing the lead.
It’s entirely normal to estimate profit and ROI potential before any of the steps above. After all, if there is no money to be made, there is no point in checking restrictions and other metrics. The reason that we analyze later in the process is because of the constant fluctuation of price and sales velocity. Because these metrics consistently change, we can identify certain trends in the metrics that allow us to predict whether a product will have profit and ROI potential in the future, and not just in the current moment. If we go straight to checking the current profit potential without checking the metric trends, a few things can happen:
- A product may show a current high ROI or profit margin, but on average it may not have good ROI or profit margins at all. This can happen because of current price hikes in the trend.
- A product may show a current low ROI or profit margin, but on average it may actually have a great ROI and profit margin. This can happen because of current price tanks in the trend.
If you are aware of the history of the product and all of the other trends, you can then make a much more educated guess as to whether or not the product will have higher ROI and profit margins in the future, as opposed to only trusting the current margins.
The Basics of Calculating Profit and ROI for Online Arbitrage Leads
Everyone has a different preference for the margins they want in their business. Without getting into deep accounting, let’s look at the basics of ROI and profit targets. We’ll briefly discuss how the profit formula works, but keep in mind that the tools you will use for sourcing will automatically make these calculations for you.
Nutshell Formula for Determining if an Online Arbitrage Product is Profitable:
Gross Item Profit = Selling Price – (Product Cost + Amazon Fees)
- Selling Price: The price we sell the item for on the Amazon marketplace
- Product Cost: The unit cost of the item when purchased from a lead source
- Amazon Fees: Amazon charges multiple fees for every item sold on their marketplace, especially if the seller is using Amazon FBA services. These include the selling commission fee, order handling fee, pick and pack fees, and weight handling fees. Basically, they take fees for storing and fulfilling your inventory for you, as well as a commission of the actual sales price. You can view more details on their fee structures here: http://www.amazon.com/gp/help/customer/display.html/ref=hp_left_ac?ie=UTF8&nodeId=200242660
The profit that a product makes is directly dependent on the sale price, product cost, and amazon fees, but there are also other factors that can eat into your margin that aren’t directly included in the gross profit formula.
Quick Sourcing Tips to Avoid Surprising or Excess Fees
It’s impossible to dissect all the different types of fees that you may or may not encounter, but here are a few things to keep in mind when sourcing products:
- The heavier and larger the item, the more it costs to ship items from a prep company to Amazon warehouses. Generally, when you are creating shipments to Amazon warehouses, it will cost you about 50 cents per pound of product. However, Amazon adds on extra fees for heavy or oversized items.
- The largest ‘normal’ box size Amazon allows for shipment to their warehouses is 18” x 18” x 24”. The larger the product, the fewer products can fit in a box, and the shipping costs usually increase closer to $1.00 / lb. If your products are too large to fit in the accepted boxes, special arrangements have to be made and fees drastically increase.
- The lighter and smaller the product, the better.
Aim for 40-50% or More Target ROI and for Online Arbitrage Leads
ROI refers to the percentage of profit compared to the money spent on purchasing a product. Ex: If you spend $5.00 on a product (your cost) and the product sells for $17.50 on Amazon, the difference is $12.50. After Amazon collects fees and commission (let’s say a total of $5.00), you are left with a $7.50 return on the original $5.00 investment you spent. So, you made your $5.00 back, plus $2.50 profit. $2.50 is 50% of the $5.00 you originally spent, so you have a 50% return on your investment.
In general, if you aim for a minimum of 50% ROI on a product, your profit margin will fall in line around 20%. 20% is around the average for gross profit on a reselling business. 40% is the minimum ROI number that we have our sourcing teams and buyers aim for. If you can make 50% ROI on a sale, then your profit is going to naturally fall in line. The higher the ROI you make, the higher your profit margin as well. So, how do you calculate your estimated ROI and Profit potentials?
Calculating Estimated ROI and Profit for Your Online Arbitrage Products
There are several different Amazon FBA calculators you can use to estimate the ROI and profit potential of a lead, but our team uses the scouting tool inside of Inventory Lab. It’s a basic all-in-one solution for accounting, creating shipments, and researching products. It’s great for beginners, especially if you don’t have a bookkeeper who is using a more advanced accounting system like Xero or Wave.
Calculating Revenue and Profits Using the General Amazon FBA Calculator:
Go to https://sellercentral.amazon.com/hz/fba/profitabilitycalculator/index?lang=en_US
Enter the ASIN for the product you are analyzing and a calculator will pop up. Enter the price you wish to sell for, as well as your cost to ship to Amazon + your cost of product and hit Calculate.

In this example, if the unit cost is $6.00 and you sell the unit for $21.90, the net estimated profit is around $9.26. The fees show about $3.29 for marketplace fees and $3.35 in Amazon FBA fulfillment fees. The amount of money Amazon would return to you for this sale is $15.26, and if you deduct your cost of $6.00, it leaves you with a profit of $9.26. So, you made your $6.00 back + an extra $9.26 profit.
One downside to this calculator is that it doesn’t show the ROI which is what we use to estimate lead potential. But, since we made an extra $9.26 back on top of our $6.00 cost, the ROI is 154.3% ((9.26 / 6.00) x 100) The Net Profit Margin is 42.28%, not to be confused with ROI. Remember, the goal is to aim for a 50% ROI, so getting an ROI of 150% is awesome! The bigger the better.
This calculator has some pains. You have to open that browser and manually type in all the information, and it doesn’t show you what the current sellers on the listing are selling at either. It also doesn’t spit out the ROI. If you wish to learn the ropes, it’s a good option to get familiar with the fee structures. You can also use the Amazon Seller Central App for mobile devices to calculate fees in a similar fashion.
ROI and Profit: How to Use RevSeller As Your Amazon FBA Calculator
We briefly touched on RevSeller earlier when discussing the process of analyzing variations, but it also has a nifty tool for quickly calculating ROI and Profit potential. One of its features is a calculator that is embedded directly in your browser when you view an Amazon listing. It allows you to immediately calculate ROI and Profit potential by entering your buy cost only at the top of the Amazon listing page. It automatically pulls the current buy-box price into the sell price input and calculates the estimated ROI and profit potential.

The $21.90 sale price was auto-generated based on the current buy-box price, and all we had to do was enter the buy-cost of $6.00 to get the estimated Net profit, ROI, and Profit Margin numbers. It also shows you other useful information such as rank, category, weight, dimensions, UPC, and more!
Again, RevSeller isn’t free, but it’s totally worth the $99.99/year if you are serious about creating an Amazon business. You can get $20 off your first year and a 30 day free trial with zero credit card needed by using code REVFBA20 at checkout.
ROI and Profit: How to Use Inventory Lab as Your Amazon FBA Calculator
After our sourcing teams put together the daily lead lists, our buyers re-analyze them using Inventory Lab’s research tool. Inventory Lab also comes with a cool app called Scoutify, but in this example, we are going to look at the traditional web app.
You can also get a free 30 day trial of Inventory Lab by going to https://sellerspaceship.com/invlab
Once in Inventory Lab, navigate to Research > Scout

Enter the ASIN and the screen above will pop up. Like RevSeller, it will automatically pull the buy-box price into the list price box, and all you have to do is enter your unit cost. It will then calculate the ROI and Net Profit, and give you a nice breakdown of fees.
You can also enter an average shipping rate into the Inventory Lab settings (we have .50/lb entered) and it will automatically deduct the inbound shipping fees to the Amazon warehouses from your margins. We highly recommend this because will give you a more accurate estimate of your return, especially if the items are heavy or oversized.
The coolest feature about Inventory Lab’s research calculator is the seller price break down. You can view all the sellers on Amazon and what they are selling for, and it’s separated between merchant sellers and FBA fulfilled sellers. In this example, there aren’t any current Amazon FBA sellers, so it’s pulling the sell price from the lowest merchant fulfilled seller instead.
In summary, there are multiple options for calculating ROI and Profit potential. If you don’t mind the extra work, using Amazon’s calculators might work best for you. But, as you advance and start growing your business, we highly suggest implementing RevSeller for sourcing and variation analysis, and Inventory Lab for secondary research, creating shipments, and managing your books.
Summary: Questions You Should Answer When Evaluating an Online Arbitrage Lead for Profit and Resale Potential
If you have followed all the steps up to this point to analyze an online arbitrage lead, you should be able to answer the following questions:
- Did you verify the pictures, UPC, and model # to make sure the product you want to resell actually matches the product you are sourcing?
- Did you check the ASIN to make sure the item isn’t restricted or HAZMAT?
- Did you check the current and average sales rank and category?
- Did you analyze the KEEPA charts for price, rank, and competition history and trends?
- Has the price recently tanked or spiked, or is there evidence there might be a massive price change in the future?
- How many direct competitors are competing for the buy-box on the listing?
- Is Amazon selling the item themselves? (Remember, there will be orange shading on the KEEPA graph)
- How many items per month is the product estimated to sell? (Use JungleScout, Unicorn Smasher, or FBA Toolkit for this.)
- Did you check the ROI and profit potential? Is the estimated ROI above 50%?
- Is the item optimal size and weight for shipping?
- What % of the profit will be absorbed by prep and shipping fees?
- Are there a high number of positive reviews and ratings?
- What colors, variations, and sizes are most popular, if applicable?
We hope this article helped you understand how to properly analyze the resale potential and profit margins of an online arbitrage lead. Once you master the metrical evaluation of the lead, it’s time to estimate how much of the lead to buy.
Grab our free 19-page guide below on how to estimate how many of a lead to buy for your online arbitrage business.
Get Your Quick Biweekly Update on News and Resources for Amazon Sellers!
Delivered to your inbox every other week.
Need-to-know seller content only. No spam. Unsubscribe at any time.
Read The Next Post:
How to Estimate the Amount of Inventory to Buy and Resell in Every Amazon Category and Rank
About The Authors


Table of Contents
1. Identifying the Product ASIN
2. The Importance of ROI and Velocity
3. Installing Plugins for Analyzing Metrics
4. Metrics to Consider for Resale Products
5. Brand Restrictions and Hazmat
6. Sales Velocity Estimations
7. The Amazon Buy-Box
8. Predicting Sales Velocity with KEEPA
9. Checking Competitor Stock Levels
10. Ratings and Reviews For Product Sales
11. Analyze Variations, Sizes, and Colors
12. Estimating ROI and Profit Potential
13. Summary